Bench answer
The reliable starting point
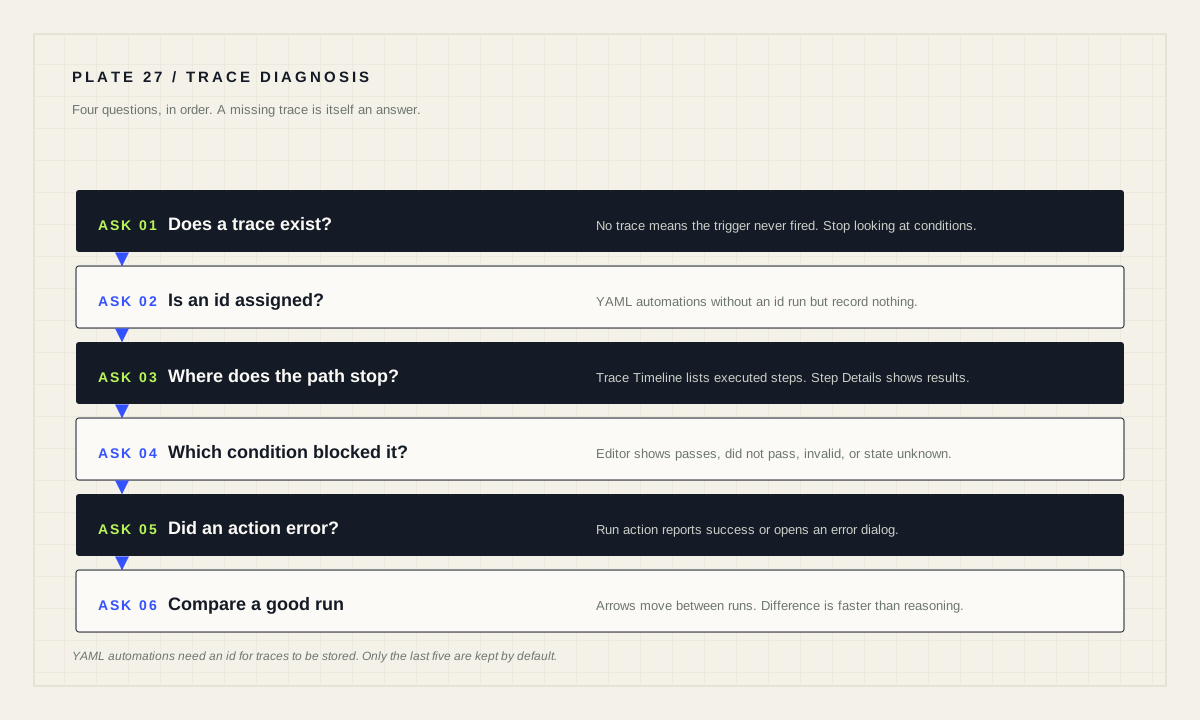
Open Traces from the automation editor or the three dots menu in the automation list. If no trace exists, the automation never ran and the problem is the trigger. If a trace exists but stops early, read which condition blocked it. If an action failed, the action row reports Error running action with details. Automations written in YAML must have an id for traces to be stored, and only the last five traces are kept unless you raise stored_traces.
Four questions, always in this order
Every misbehaving automation is answering one of four questions, and answering them out of order wastes the most time.
One: did it run at all? If there is no trace for the moment in question, the trigger did not fire. Nothing about the conditions or actions is relevant yet.
Two: did the conditions pass? If a trace exists but ends early, a condition blocked it, and the trace shows which one.
Three: did an action fail? If the trace reaches the actions and stops midway, one action errored.
Four: did it do the right thing at the wrong moment? This is a design problem, not a fault, and it is solved by changing the trigger or the conditions rather than by debugging.
When an automation runs, all steps are recorded and a trace is made. The graph is interactive: each node can be selected to view details of what happened at that specific step, and the highlighted path shows the route the run actually took.
What the trace screen actually contains
Open the automation editor from Settings → Automations & scenes, then select Traces from the editor or from the three dots menu in the automations list. You can also select an automation entry shown under Activity.
The right side of the trace screen carries the useful detail. Step Details shows data and results for the currently highlighted step — this is where a rendered template value or a returned payload becomes visible. Automation Config shows the full YAML configuration at the time the automation was run, which matters when you have edited it since. Trace Timeline lists the executed steps and their timing. Related activity shows activity for all entries related to that trace. Blueprint Config appears only when the automation was created from a blueprint.
The top bar shows the date and time the automation was triggered, and left and right arrows move between previous runs. That arrow navigation is how you compare a good run with a bad one, which is usually faster than reasoning about either in isolation.
When there is no trace at all
Two causes account for most missing traces. First, the trigger genuinely did not fire — the state change you expected did not happen, or did not happen in the direction you specified. Open the entity's history and confirm the change occurred at the moment you assume it did.
Second, and easy to miss: automations created in YAML must have an id assigned in order for debugging traces to be stored. An automation without one will run correctly and record nothing, which looks exactly like an automation that never runs.
There is also a retention limit. The last five traces are recorded for all automations by default. For an automation that fires often, the run you care about may simply have aged out. You can raise this per automation:
# Keep more history for an automation you are actively debugging.
trace:
  stored_traces: 20
Set this while investigating and consider lowering it afterwards; traces are not free, and twenty stored runs across every automation in a large installation adds up.
When a condition blocked the run
The editor makes condition state visible without waiting for a run. Hover the state indicator circle on the left of a condition row to see one of four states: Condition passes, Condition did not pass, Invalid condition configuration — for example an invalid input value for an option — or Condition state unknown, where the state cannot be checked due to a missing input value. Verification is automatic and continuous, so editing an option updates the state immediately.
Each condition can also be tested individually from the three dots menu on its row. Testing highlights the condition to show whether it passed at the moment of testing, and the row displays Condition passes or Condition did not pass. Testing a building block such as an and condition reports whether the whole block registers as true or false, and you can also test individual conditions inside it.
Be careful about timing when interpreting these results. A condition that passes now may not have passed at the moment the automation ran, which is exactly what the trace records and a live test does not.
When an action failed
Each action can be run individually: on the right of the action row, select the three dots menu and choose Run action. The block runs immediately, and the row reports Action ran successfully or Error running action — selecting the error message opens a dialog with more information.
To test the whole sequence, use Run actions from the three dots menu in the automation list or editor. This executes all actions while skipping all triggers and conditions, as if the automation had been triggered with everything true. Note the documented limitation: any trigger ID used in your triggers will not be active when testing this way, and the trigger ID or data passed in the trigger variable cannot be tested directly.
For a test that does exercise conditions, go to Settings → Developer tools → Actions, choose Automation: Trigger, select the automation, toggle whether to skip the conditions, and perform the action. Additional trigger data can be supplied in the YAML view for testing.
The documentation is candid that complex automations depending on previous blocks — trigger IDs, template variables, or action calls that return data used by later steps — cannot be tested block by block. Those need a real trigger and a real trace.
Habits that prevent the next investigation
When an event fires a trigger, the trigger row displays the message Triggered in the editor, and selecting it shows the YAML in a Triggering event detail dialog. Watching that while producing a real event is the fastest way to confirm a trigger definition matches reality.
Validate before restarting. In Developer tools → YAML, the Configuration validation section has a Check configuration button, which catches syntax errors before a restart turns a typo into an outage.
And change one thing at a time. The reason the same bug gets fixed repeatedly is that three edits went in together, the symptom moved, and nobody learned which edit mattered. A trace tells you what happened; a disciplined edit tells you why.
Diagnostic order for automations
- Does a trace exist for the moment in question?
- If not: does the automation have an
id, and did the source entity actually change? - If a trace exists: which step is the last one on the highlighted path?
- Condition state checked in the editor and compared with the trace.
- Failing action run individually and its error dialog read.
stored_tracesraised while investigating a frequent automation.- One change made, then a real trigger produced and the new trace compared.
Source desk
Primary documentation used for this guide. Interface names and behaviors can change; confirm the current page before changing a live installation.
- Testing and troubleshooting automationsOfficial traces, condition indicators, per-block testing and stored_traces.Official source ↗
- Automation triggersOfficial trigger ID behaviour referenced during diagnosis.Official source ↗
- Automation YAMLOfficial automation id requirement for stored traces.Official source ↗
Source review completed .
Frequent questions
Where do I find automation traces?
From the automation editor or the three dots menu in the automations list, select Traces. You can also select an automation entry shown under Activity.
Why does my YAML automation have no traces?
Automations created in YAML must have an id assigned in order for debugging traces to be stored.
How many traces are kept?
The last 5 traces are recorded for all automations. You can change this per automation by adding trace: stored_traces: 20.
What does Run actions test, and what does it skip?
It executes all actions while skipping all triggers and conditions. Trigger IDs are not active when testing this way, so logic depending on them cannot be tested directly.
What do the condition state indicators mean?
Condition passes, Condition did not pass, Invalid condition configuration for an invalid input value, and Condition state unknown when the state cannot be checked due to a missing input.